The Group Analytics feature on the CSUK:ReviseCS Teacher Dashboard is a powerful tool designed to provide comprehensive insights into your group's academic performance. This feature encompasses several aspects:
Detailed Performance Overview:
- Gain a holistic view of your group's engagement with Course Quizzes, Exams, and Infinity Quiz Questions. This overview includes data on the number of questions attempted and their success rates, offering a clear picture of academic progress.
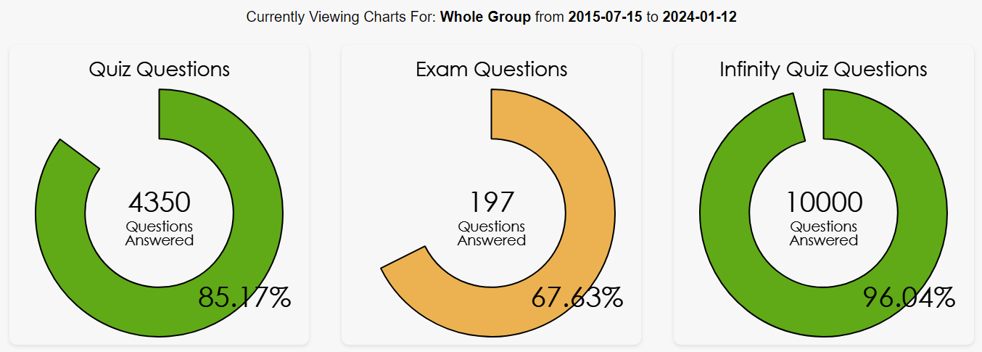
Dynamic Graphical Representations:
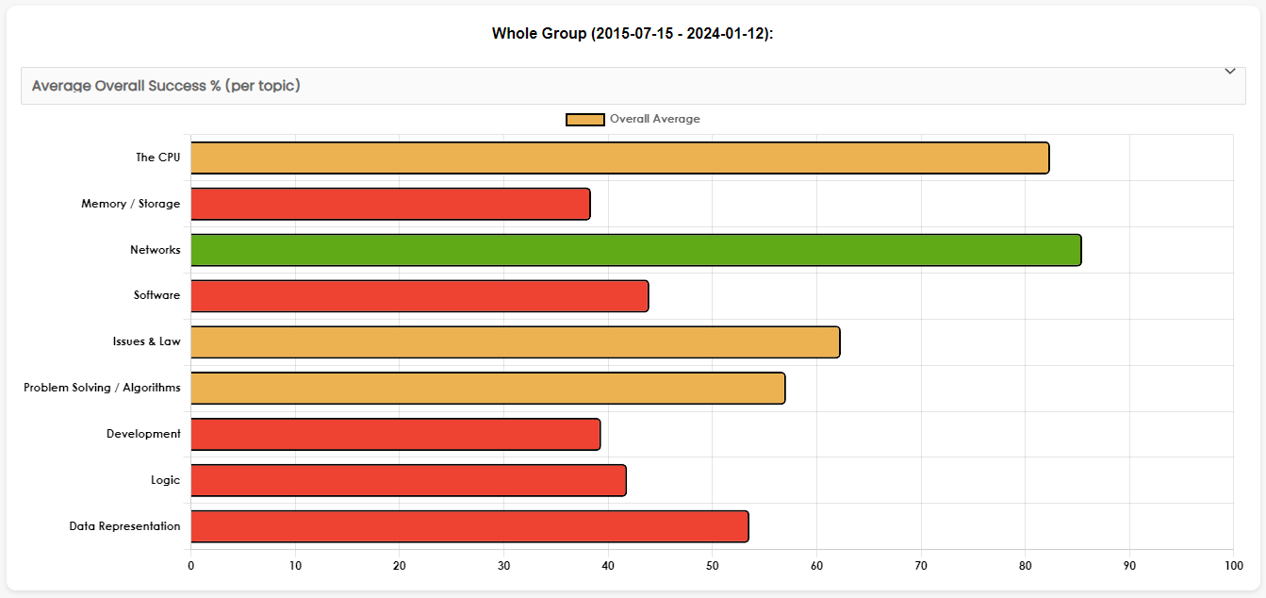
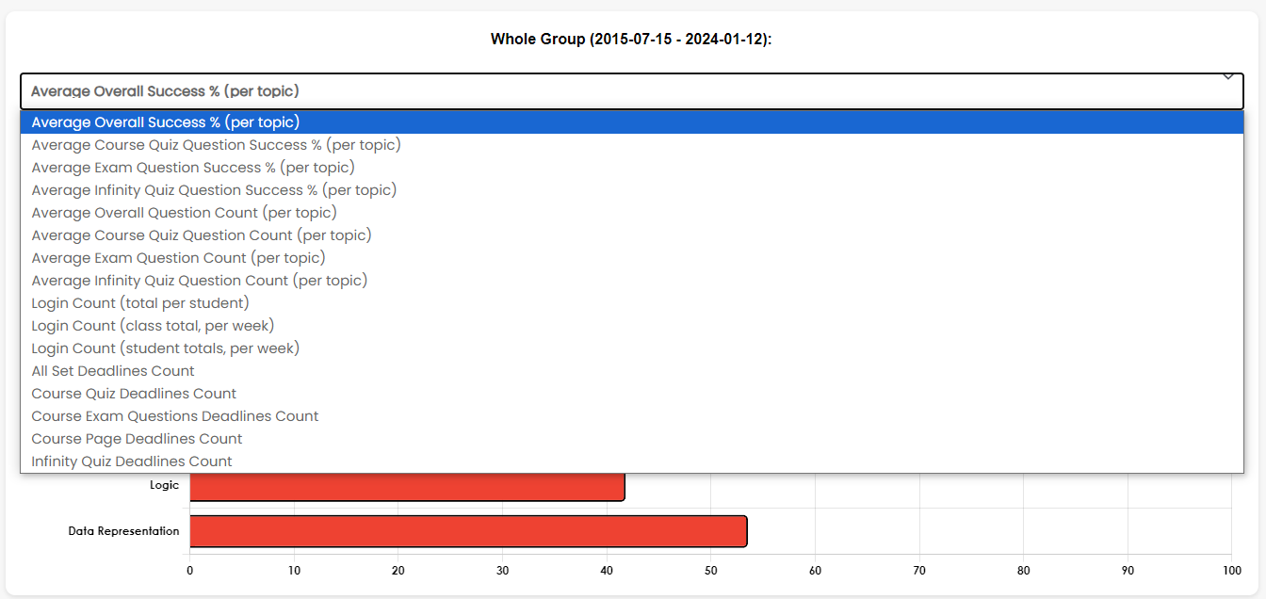
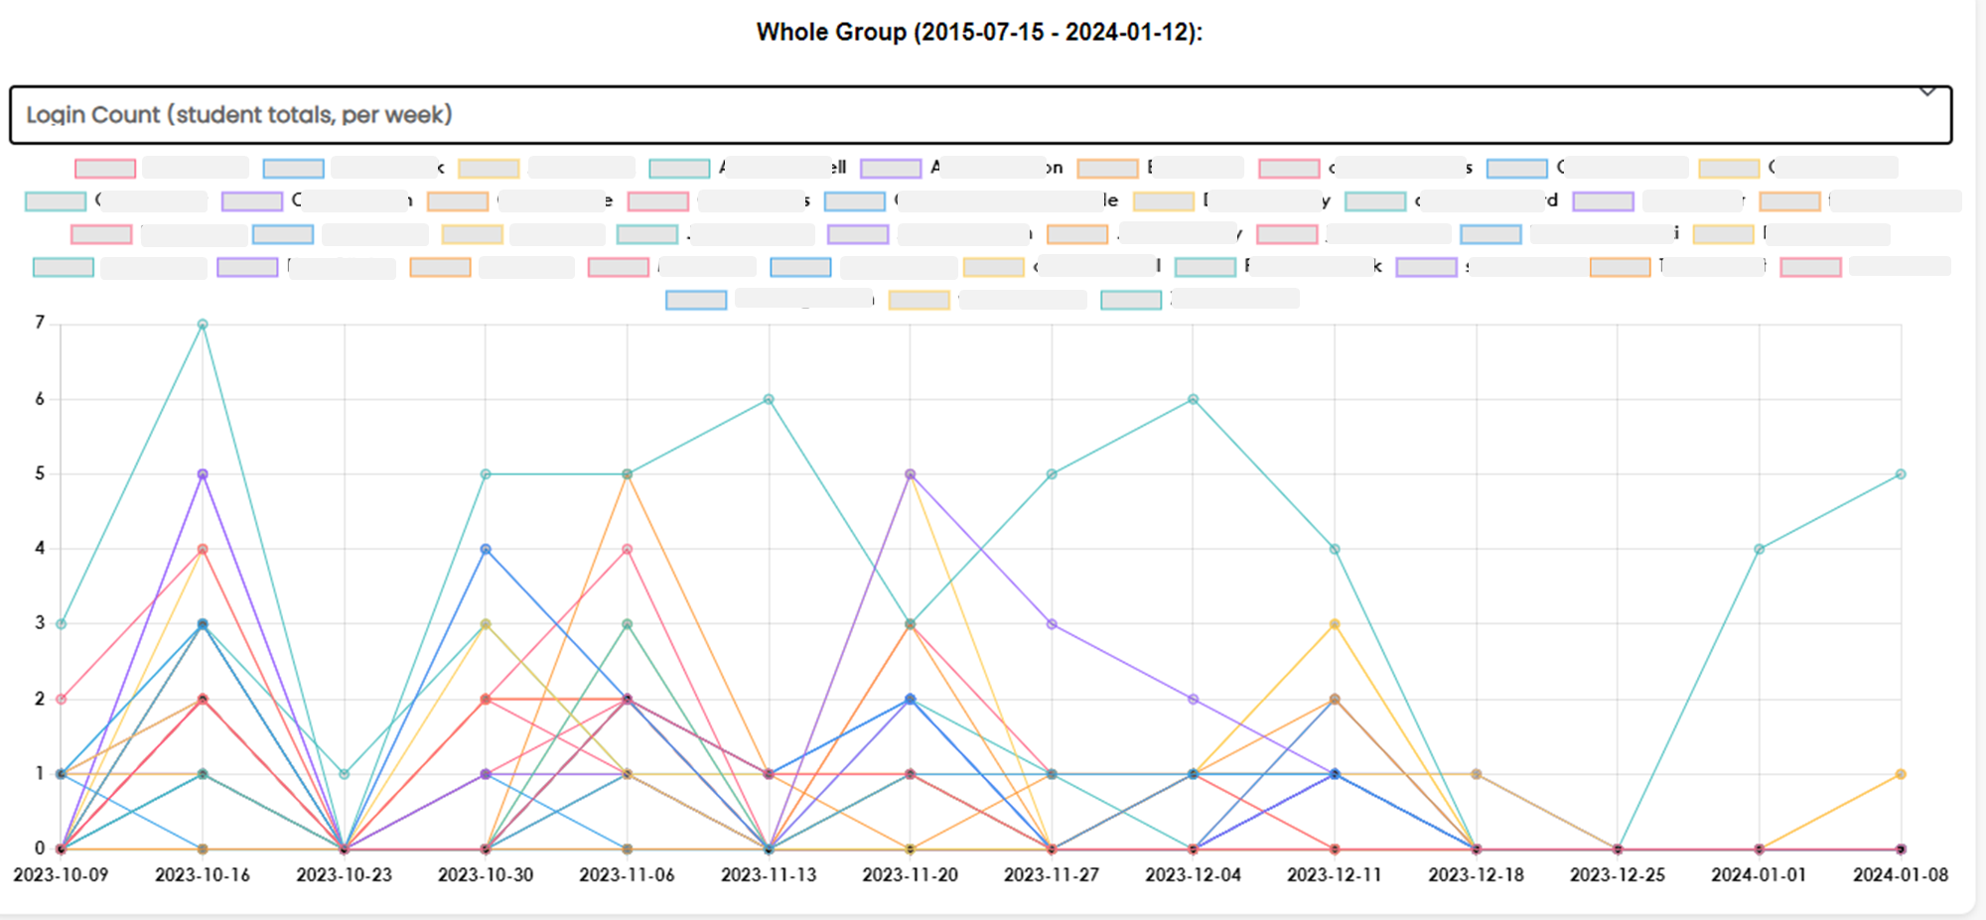
- Explore a variety of dynamically generated graphs that provide visual metrics on overall topic performance, frequency of site logins, and more. These graphs are designed for intuitive and quick interpretation, facilitating a more efficient analysis of student data.
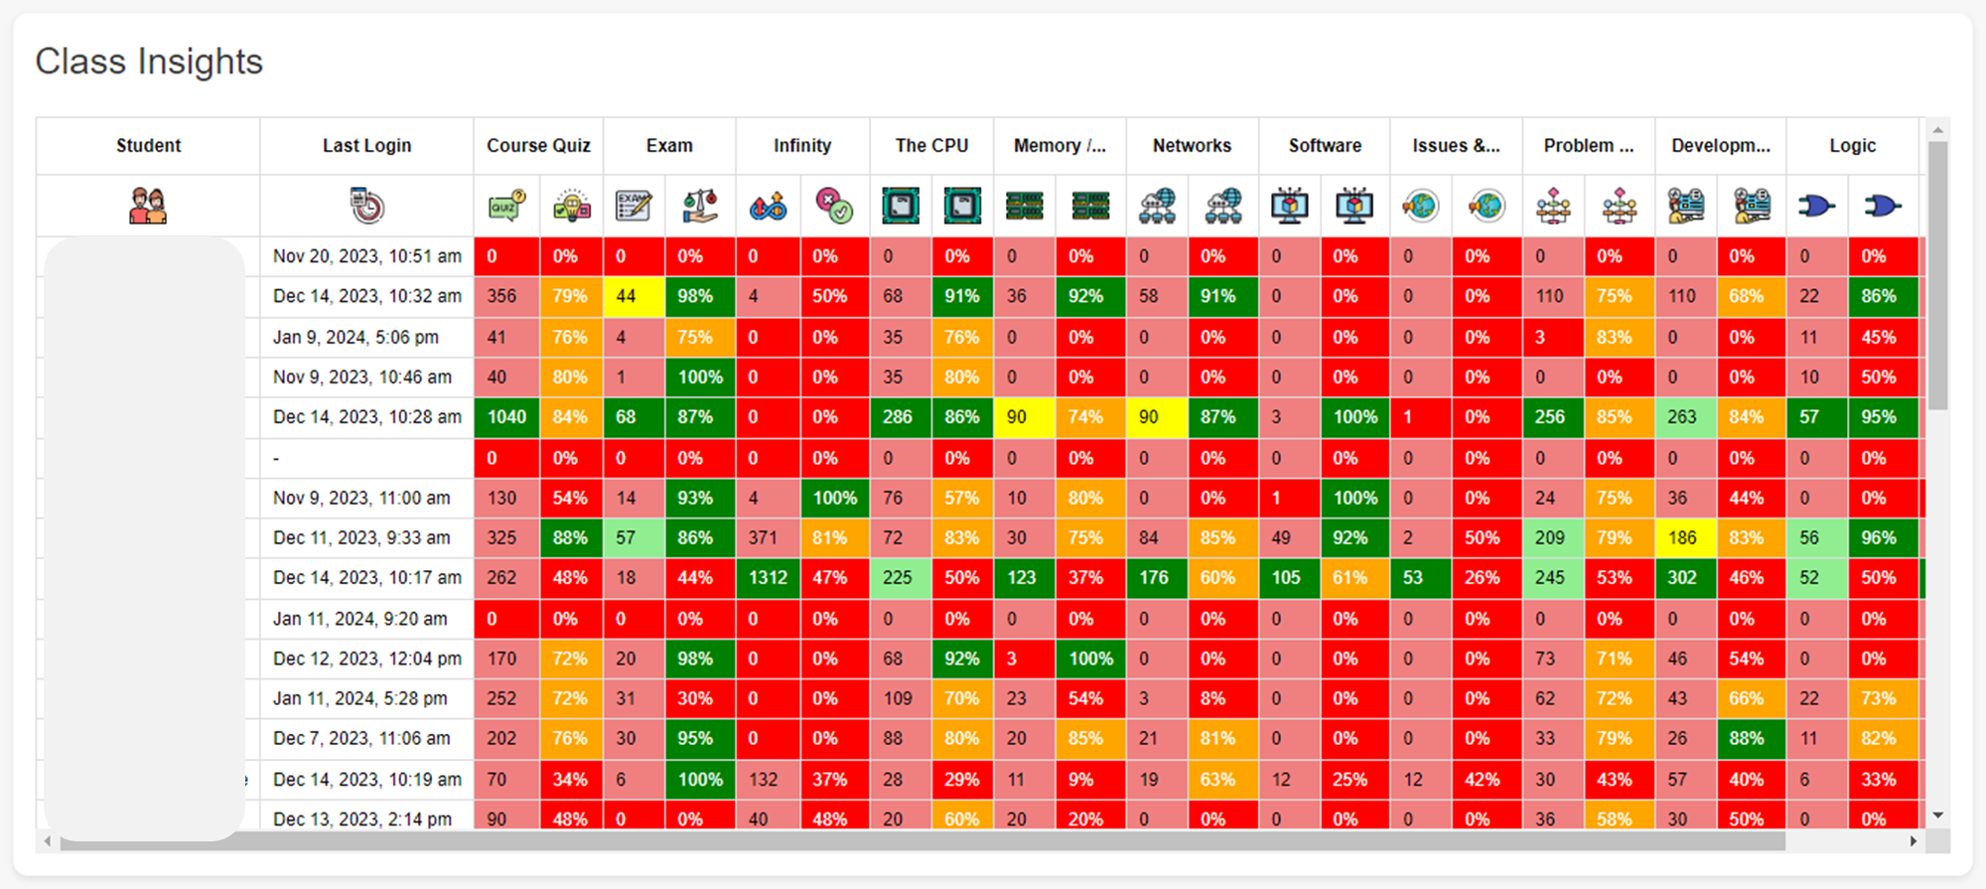
Class Insights Table
The Class Insights Table complements Group Analytics by providing:
- Snapshot View of Student Performance:
- This table offers a concise yet comprehensive view of each student's performance and engagement. It's easily sortable, with conditional formatting that enhances clarity and helps you quickly identify trends and outliers in student performance.
- Comparative Analysis Tools:
- By clicking on column headers, you can perform comparative analyses of your students’ achievements. This function allows you to evaluate student performance in specific quizzes or topics, using success rates and question engagement as key metrics.
Both the Group Analytics and Class Insights Table are designed to provide educators on the CSUK:ReviseCS platform with in-depth, actionable insights into student performance and engagement. These tools empower teachers to make data-driven decisions that enhance the learning experience and outcomes for their students.
